Now Reading: GCC Build-Operate-Scale Cost ROI Simulator
- 01
GCC Build-Operate-Scale Cost ROI Simulator
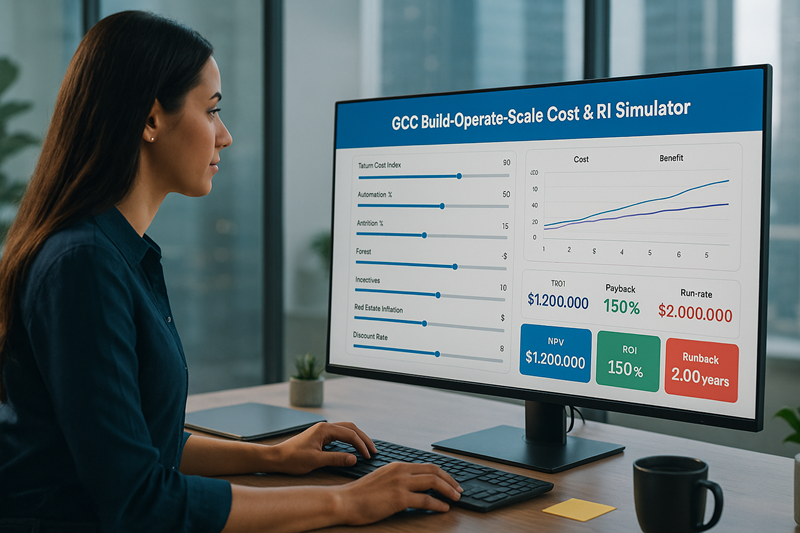

GCC Build-Operate-Scale Cost & ROI Simulator
Single column layout for clarity. Model Build - Operate - Scale economics for India, GCC, and LATAM. Adjust cost inputs and market levers, then analyze KPIs and cashflows.
How to use
Pick a city tab, enter your Cost Inputs, tweak Levers, then click Analyze All. Use Sync buttons to copy active city settings to the others.
Inputs - India
Talent rich - INRCost Inputs set base economics. Levers reflect market conditions like talent price, automation, attrition, FX, incentives, and real estate inflation.
Cost Inputs - your numbers
Levers - operating environment
KPIs - India
NPV, ROI, Payback, and Y3 run rate reflect India inputs and levers.
Inputs - GCC
High infra - AED - SAREnter GCC costs and adjust levers for hiring markets, incentives, FX, and real estate dynamics.
Cost Inputs - your numbers
Levers - operating environment
KPIs - GCC
Inputs - LATAM
Nearshore TZ - BRL - MXNCapture LATAM cost structure and tune levers for FX, incentives, talent, and real estate dynamics.
Cost Inputs - your numbers
Levers - operating environment
KPIs - LATAM
Comparison - NPV and ROI
Quick view to rank locations by value.
Abbreviations and glossary
CapEx: capital expenditure. OpEx: operating expenditure. KT: knowledge transfer. FX: foreign exchange index. NPV: net present value. ROI: return on investment. DCF: discounted cash flow. Y3 run rate: operating cost level in year 3.
Disclaimer
These tools are meant to provide quick, general insights, not exhaustive advice. They should not replace professional consultation or in-depth analysis. Users are encouraged to verify information and seek expert guidance before making decisions.
Contact Expert